


Latest Version
Version
1.0.0+25030301
1.0.0+25030301
Update
September 09, 2025
September 09, 2025
Developer
株式会社セコニック
株式会社セコニック
Categories
Tools
Tools
Platforms
Android
Android
Downloads
0
0
License
Free
Free
Package Name
jp.co.sekonic.c4000
jp.co.sekonic.c4000
Report
Report a Problem
Report a Problem
More About SEKONIC LD
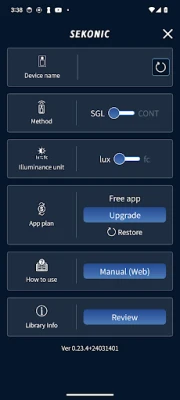
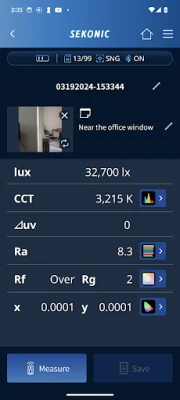
With SEKONIC LD, you can use the full functionality of the spectrometer C-4000. You can remotely control the C-4000 via Bluetooth and view graphs of measurement data in various way. It displays illuminance (lux or foot-candle), deviation (⊿uv), color temperature (K), color rendering index (CRI/TM-30), and CIE1931 chromaticity coordinates (x,y). and imports stored data from the C-4000. Get 40% off a 12-month subscription or 20% off a 3-month one until June 31, 2025. Regular rates apply at renewal.
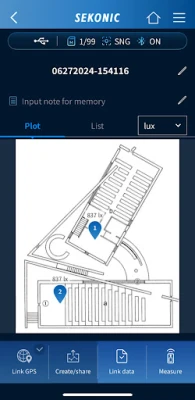
SEKONIC LD offers upgrade option with in-app purchases (3-month subscription, 12-month subscription), including a 2-week free trial. With the upgrade, you can import drawings such as lighting layouts or site photos, and link measured values directly on them. Even if you stop the measurement midway, you can add notes to the saved data, making it convenient for multiple measurements. You can also attach smartphone images and notes to each measurement data. Location information of sites can also be attached with GPS data.
Compile project data into simple reports, output as PDFs, or export as CSVs for further processing.
Compile project data into simple reports, output as PDFs, or export as CSVs for further processing.
Rate the App
Add Comment & Review
User Reviews
Based on 0 reviews
No reviews added yet.
Comments will not be approved to be posted if they are SPAM, abusive, off-topic, use profanity, contain a personal attack, or promote hate of any kind.


More »

Popular Apps

Mahjong SoulYostar Limited.

AP Exhaust CatalogShowMeTheParts

Annelids: Online battleMichal Srb

Sandwich Run: Runner GameGame Metrix
Flood It - Color PuzzleBlogger Nepal
M Performance Sound PlayerINATRONIC
Sail-Jobs in Japan-JLPT N1/N2Helte Co., Ltd.

King of Sails: Ship BattleAzur Interactive Games Limited

Flood WarsViacheslav Filonenko

Pixel Car RacerStudio Furukawa
More »
Editor's Choice
Pam AppPamela Rf
botimAlgento Cloud Computing Limited

Chatta-Live Match New FriendsMETAZ TECHNOLOGY PTE. LTD.

LiveScore: Live Sports ScoresLiveScore Limited

bubble for ACTORSDear U Co., Ltd.

AkinatorElokence SAS

Halloween Color By Number GameArt Coloring Group
Color by NumberClassic Puzzle Games Maker
Color by Number:Coloring GamesWildlife Studios

Tap Color® Color by numberTap Color Studio